![[-]](/moniwiki/imgs/plugin/arrup.png "[-]")
![[+]](/moniwiki/imgs/plugin/arrdown.png "[+]")
[edit]
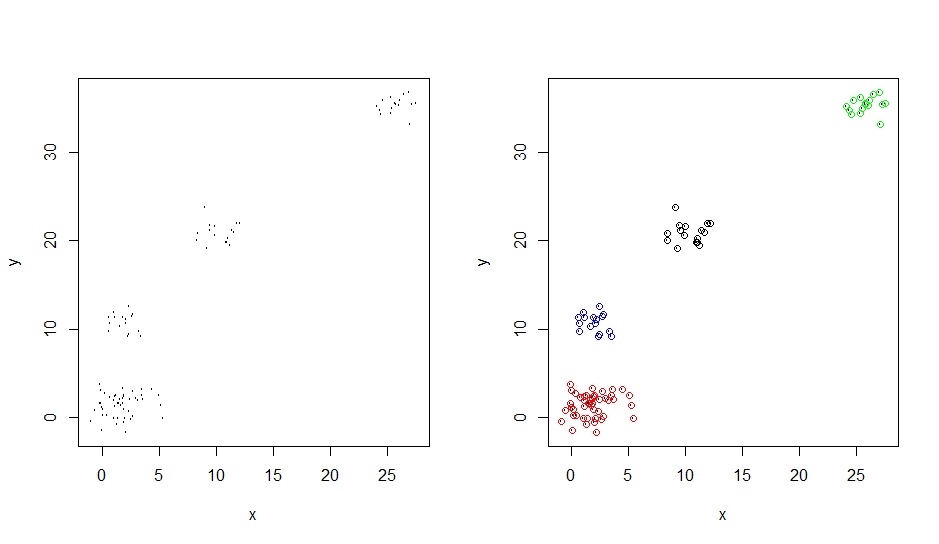
2 예제 #
데이터
n = 100
g = 6
set.seed(g)
d <- data.frame(x = unlist(lapply(1:g, function(i) rnorm(n/g, runif(1)*i^2))),
                y = unlist(lapply(1:g, function(i) rnorm(n/g, runif(1)*i^2))))
library(fpc)
library("cluster")
#최적의 k값을 찾음

#k <- pamk(d)$nc
k <- pamk(d)$nc+1
cl <- pam(d, k)
result <- data.frame(d, clusterid=cl$clustering)

par(mfrow=c(1,2))

plot(d, cex=0.2)
plot(d, cex=0.2)
colour <- c("red", "blue", "black", "green")
points(result$x, result$y, col=c(colour[result$clusterid]))

par(mfrow=c(1,1))
[edit]
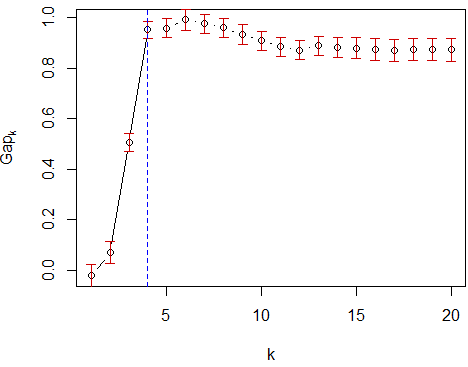
3 최적의 k를 찾는 다른 방법 #
참고: http://stackoverflow.com/questions/15376075/cluster-analysis-in-r-determine-the-optimal-number-of-clusters
n = 100
g = 6
set.seed(g)
d <- data.frame(x = unlist(lapply(1:g, function(i) rnorm(n/g, runif(1)*i^2))),
                y = unlist(lapply(1:g, function(i) rnorm(n/g, runif(1)*i^2))))
sim <- clusGap(d, FUN = pam, K.max = 20, B = 100)
k <- with(sim, maxSE(Tab[,"gap"],Tab[,"SE.sim"]))
plot(sim)
abline(v=k, lty=2, col="blue")
k-means 예제
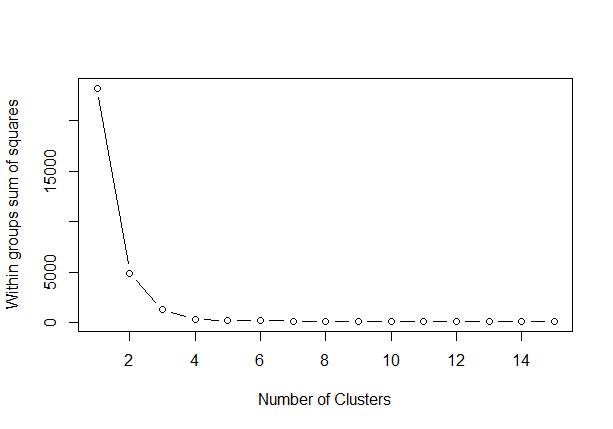
wss <- (nrow(d)-1)*sum(apply(d,2,var))
for (i in 2:15) wss[i] <- sum(kmeans(d, centers=i)$withinss)
plot(1:15, wss, type="b", xlab="Number of Clusters", ylab="Within groups sum of squares")