Contents
- 1 л№„м„ нҳ•
- 2 nм°Ё н•ЁмҲҳ curve fitting
- 3 self-starting function
- 4 inverse.predict
- 5 bi-exponential
- 6 exp * 3
- 7 log-normal function
- 8 pareto
- 9 л©ұн•ЁмҲҳ 3к°ң
- 10 мЈјкё° м•Ңм•„лӮҙкё°
- 11 smooth
- 12 л№„м„ нҳ• нҡҢк·Җ мӢ лў°кө¬к°„
- 13 beta
- 14 95% мӢ лў°кө¬к°„
- 15 sigmoid 0 ~ 1
- 16 Laplace Distribution(Double exponential)
- 17 м°ёкі мһҗлЈҢ
library(nlstools)
plotfit(fit, smooth=TRUE)
overview(fit)
plotfit(fit, smooth=TRUE)
overview(fit)
fit.boot <- nlsBoot(fit, niter = 200)
summary(fit.boot)
summary(fit.boot)
[edit]
1 л№„м„ нҳ• #
лӢӨмқҢмқҳ мһҗлЈҢлҘј ліҙл©ҙ, м„ нҳ•мқҙ м•„лӢҳмқ„ м•Ң мҲҳ мһҲлӢӨ.
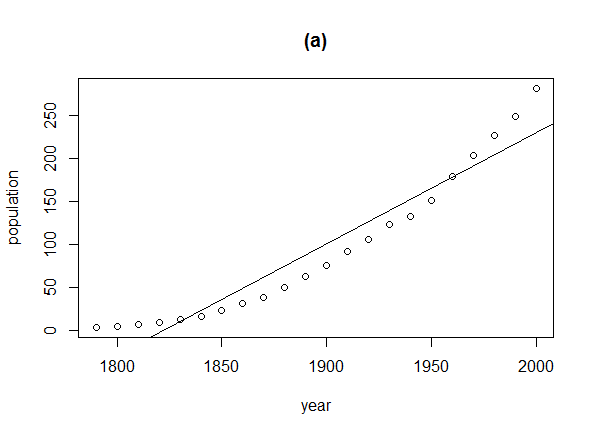
install.packages("car")
library("car")
plot(population ~ year, data=USPop, main="(a)")
abline(lm(population ~ year, data=USPop))

[edit]
2 nм°Ё н•ЁмҲҳ curve fitting #
curve fitting н•ҙліҙмһҗ.
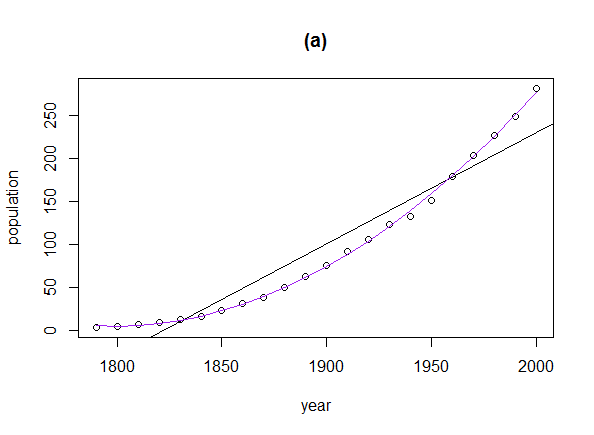
xx <- USPop$year
fit <- lm(population ~ poly(year, 2), data=USPop)
lines(xx, predict(fit, data.frame(year=xx)), col="purple")

к·ёлҹ°лҚ° USPop лҚ°мқҙн„°лҠ” м•„лһҳмҷҖ к°ҷмқҖ logistic growth model мқҙлқјкі н•ңлӢӨ.
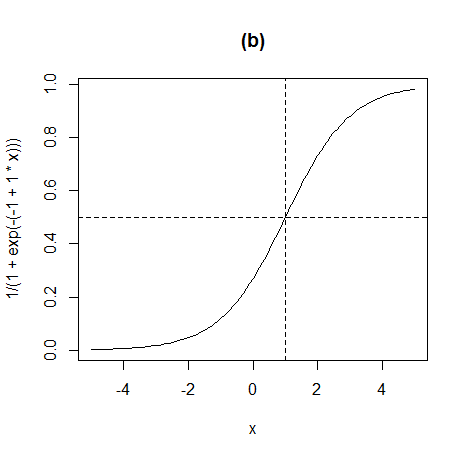
curve(1/(1+exp(-(-1 + 1*x))), from=-5, to=5, main="(b)")
abline(h=1/2, lty=2)
abline(v=1, lty=2)

[edit]
3 self-starting function #
nм°Ён•ЁмҲҳлЎң fitting н•ҳлҠ” кІғмқҖ мң„мҷҖ к°ҷмқҙ н•ҳл©ҙ лҗҳкі , м•„л§ҲлҸ„ лҢҖл¶Җ분мқҖ м•Ңл Ө진 кіөмӢқл“Өмқј кІғмқҙлӢӨ. м•„лһҳлҠ” self-starting functionл“ӨмқҙлӢӨ.
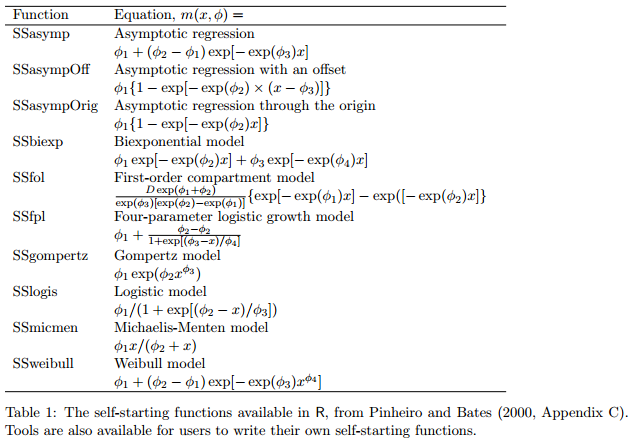
nм°Ён•ЁмҲҳ curve fittingмқҙлӮҳ м•„лһҳмҷҖ к°ҷмқҙ self-starting functionмқ„ мқҙмҡ©н•ҳл©ҙ лҗ кІғмқҙлӢӨ.
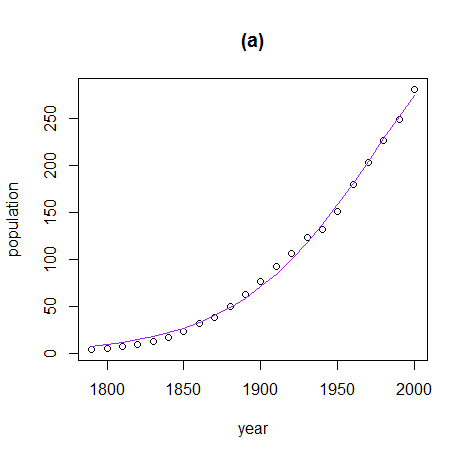
fit <- nls(population ~ SSlogis(year, Asym, xmid, scal), data=USPop)
summary(fit)
xx <- USPop$year
plot(population ~ year, data=USPop, main="(a)")
lines(xx, predict(fit, data.frame(year=xx)), col="purple")

SSasymp(input, Asym, R0, lrc)
SSasympOff(input, Asym, lrc, c0)
SSasympOrig(input, Asym, lrc)
SSbiexp(input, A1, lrc1, A2, lrc2)
SSfol(Dose, input, lKe, lKa, lCl)
SSfpl(input, A, B, xmid, scal)
SSgompertz(input, Asym, b2, b3)
SSlogis(input, Asym, xmid, scal)
SSmicmen(input, Vm, K)
SSweibull(input, Asym, Drop, lrc, pwr)
м•„лһҳлҠ” self-starting function лӘҮ к°ңлҘј м Ғмҡ©н•ң кІғмқ„ м°ЁнҠёлЎң 비көҗн•ҙліё кІғмқҙлӢӨ. self-starting functionмқҳ нҢҢлқјлҜён„°лҠ” м ҒлӢ№н•ң(мҳҲлҘј л“Өм–ҙ, helpмҷҖ к°ҷмқҙ) ліҖмҲҳлҘј л„Јкі , м—җлҹ¬к°Җ лӮҳл©ҙ м•ҲлҗҳлҠ”кұ°кі , лҗҳлҠ” лҗҳлҠ” кұ°кі лӢӨ.
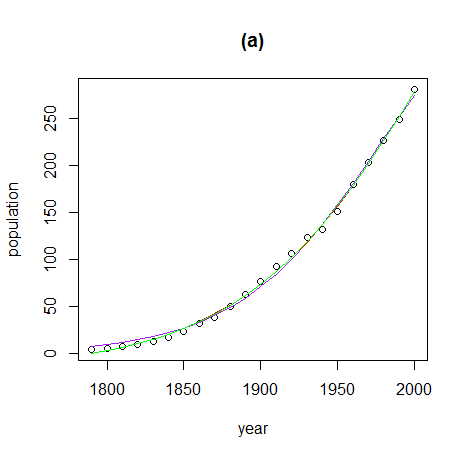
xx <- USPop$year
plot(population ~ year, data=USPop, main="(a)")

fit1 <- nls(population ~ SSlogis(year, Asym, xmid, scal), data=USPop)
lines(xx, predict(fit1, data.frame(year=xx)), col="purple")

fit2 <- nls(population ~ SSweibull(year, Asym, Drop, lrc, pwr), data=USPop)
lines(xx, predict(fit2, data.frame(year=xx)), col="red")

fit3 <- nls(population ~ SSfpl(year, A, B, xmid, scal), data=USPop)
lines(xx, predict(fit3, data.frame(year=xx)), col="green")

추к°Җ self-starting function
https://cran.r-project.org/web/packages/nlraa/vignettes/nlraa.html
https://cran.r-project.org/web/packages/nlraa/vignettes/nlraa.html
Functions in вҖҳbaseвҖҷ R stats package SSasymp (Asymptotic) SSasympOff (Asymptotic with an offset) SSasympOrig (Asymptotic through the Origin) SSbiexp (Bi-exponential) SSfol (First order compartment) SSfpl (Four parameter logistic) SSgompertz (Gompertz) SSlogis (Logistic) SSmicmen (Michaelis-Menten) SSweibull (Weibull) Functions in this package (nlraa) SSbgf (Beta-Growth Function) SSbgf4 (Four Parameter Beta-Growth Function) SSbgrp (Beta-Growth Reparameterized) SSbg4rp (Four Parameter Beta-Growth Reparameterized) SSdlf (Declining Logistic Function) SSricker (Ricker population growth) SSprofd (Profile of protein distribution) SSnrh (Non-rectangular hyperbola) SSlinp (linear-plateau) SSplin (plateau-linear) SSquadp (quadratic-plateau) SSpquad (plateau-quadratic) SSblin (bilinear) SSexpf (exponential function) SSexpfp (exponential-plateau) SSpexpf (plateau-exponential) SSbell (bell-shaped function) SSratio (rational function) SSlogis5 (five-parameter logistic) SStrlin (tri-linear function) SSexplin (expolinear)
[edit]
4 inverse.predict #
install.packages("chemCal")
library("chemCal")
fit1 <- rlm(dau ~ x, data=tmp)
inverse.predict(fit1, 500000) #dauк°Җ 500000мқҙ лҗҳл Өл©ҙ xлҠ” лӘҮмқҙм–ҙм•ј н•ҳлҠ”к°Җ?
[edit]
5 bi-exponential #
> head(df)
  seq    u
1   1 4311
2   2 2381
3   3 1981
4   4 1529
5   5 1386
6   6 1340
x1 <- df[1:7,]
x2 <- df[8:nrow(df),]

cc1 <- coef(lm(log(u) ~ seq, data=x1))
cc2 <- coef(lm(log(u) ~ seq, data=x2))

fit <- nlsLM(u ~ a*exp(b * seq) + c * exp(d * seq),
             start = list(a=cc1[1], b=cc1[2], c=cc2[1], d=cc2[2]),
             data=df)
[edit]
6 exp * 3 #
#exp * 3
r <- sort(unique(df.ko$ranking))
xlim <- c(1,max(r))
ylim <- c(0, max(df.ko$amt) + max(df.ko$amt) * 0.3)
plot(df.ko$ranking, df.ko$amt, cex=0.1, pch=19, xlim=xlim, ylim=ylim, xlab="м°ЁмҲҳ", ylab="u", main="bi-exp")
x1 <- df.ko[df.ko$ranking <= 7,]
x2 <- df.ko[df.ko$ranking > 7 & df.ko$ranking <= 20 ,]
x3 <- df.ko[df.ko$ranking > 21,]
cc1 <- coef(lm(log(amt) ~ ranking, data=x1))
cc2 <- coef(lm(log(amt) ~ ranking, data=x2))
cc3 <- coef(lm(log(amt) ~ ranking, data=x3))
fit <- nlsLM(u ~ a*exp(b * seq) + c*exp(d * seq) + e*exp(f * seq),
start = list(a=cc1[1], b=cc1[2], c=cc2[1], d=cc2[2], e=cc3[1], f=cc3[2]),
data=df)
summary(fit)
lines(r, predict(fit, data.frame(ranking=r)), col="red")
#text(df$seq, df$u, df$w, cex=0.5, pos=4)
amt1 <- predict(fit, data.frame(ranking=r))
amt1 / sum(amt1)
r <- sort(unique(df.ko$ranking))
xlim <- c(1,max(r))
ylim <- c(0, max(df.ko$amt) + max(df.ko$amt) * 0.3)
plot(df.ko$ranking, df.ko$amt, cex=0.1, pch=19, xlim=xlim, ylim=ylim, xlab="лһӯнӮ№", ylab="л§Өм¶ң", main="н•ңкөӯ")
lines(r, predict(fit, data.frame(ranking=r)), col="red")
lines(r, coef(fit)[1]*exp(coef(fit)[2] * df$seq), col="blue")
lines(r, coef(fit)[3]*exp(coef(fit)[4] * df$seq), col="green")
lines(r, coef(fit)[5]*exp(coef(fit)[6] * df$seq), col="black")
[edit]
7 log-normal function #
fun <- function(x, mu, sd){
    a <- 1/(x * sqrt(2*pi*sd))
    b <- (log(x)-mu)^2 * -1
    c <- 2 * sd^2
    return (a * exp(b/c))
}
мҳҲм ң
#data
val <- c(462604.2114,724545.9975,677961.1773,556621.1925,572068.4823,550408.0245,442748.9577,463050.285,485241.4509,406399.9335,394768.1661,474606.3792,408121.4988,254290.8273,234755.1933,201690.9834,
175243.2,171106.0665,228024.2613,199481.5251,141505.8969,148199.988,138756.7692,140078.0631,146512.2765,183688.7274,169084.7955,103705.1421,107350.3998,106554.8355,99301.161,105367.9611,148672.9455,
135343.5096,73087.3671,75604.4967,69973.8132,66367.3878,72191.2371,98143.1619,88506.7773,59722.086,59705.1591,54111.3165,49504.2126,50762.7774,68940.2766,67763.3592,50401.3383,50509.8696,51749.5161,
56774.814,56875.3797,65898.4131,58036.3659,45687.6945,44862.2592,41548.5696,37896.342,39405.8232,54220.8435,50035.9164,36221.5746,35067.5583,33099.0594,41550.561,33312.1392,42200.7531,36982.2894,26394.0156,
25939.9764,24163.6476,23641.9008,25495.8942,35859.1398,31292.8596,20783.2461,21233.3025,20770.302,20744.4138,19822.3956,31262.9886,28102.6368,17650.7739,17666.7051,17097.1647,16079.5593,17644.7997,26329.2951,
22879.1946,14800.0848,15000.2205,15227.2401,19307.6187,20345.1381,27219.4509,22791.573,14828.9601,26459.7318,65060.0337)
seq <- 1:length(val)
tmp <- data.frame(seq, val)

#log-normal function
fun <- function(x, mu, sd){
    a <- 1/(x * sqrt(2*pi*sd))
    b <- (log(x)-mu)^2 * -1
    c <- 2 * sd^2
    return (a * exp(b/c))
}

#fitting
library("minpack.lm")
fit <- nlsLM(val ~ a * fun(seq, b, c) + d,
             start = list(a=1, b=0.01, c=100, d=1),
             control = nls.lm.control(maxiter = 1000),
             trace = TRUE,
             data=tmp)

#plotting
r <- sort(unique(tmp$seq))
xlim <- c(1,max(r))
ylim <- c(0, max(tmp$val) + max(tmp$val) * 0.3)
plot(tmp$seq, tmp$val, cex=0.1, pch=19, xlim=xlim, ylim=ylim)
lines(r, predict(fit, data.frame(seq=r)), col="red")
[edit]
8 pareto #
pareto <- function(y, m, s) {
  return (s * (1 + y/(m * (s-1)))^(-s-1)/(m * (s-1)))
}
лҳҗлҠ”
install.packages("rmutil")
library("rmutil")

dpareto(y, m, s, log=FALSE)
ppareto(q, m, s)
qpareto(p, m, s)
hpareto(y, m, s)
rpareto(n, m, s)
[edit]
9 л©ұн•ЁмҲҳ 3к°ң #
library("minpack.lm")
fit <- nlsLM(u ~ a*seq^b + c*seq^d + e*seq^f,
             start = list(a=40000000, b=-0.05, c=8015503, d=-0.05, e=1674444, f=-0.05),
             control = nls.lm.control(maxiter=1000),
             data=df, trace=T)
summary(fit)
[edit]
10 мЈјкё° м•Ңм•„лӮҙкё° #
calcPeriod <- function(x, y){
    incr <- x[2] - x[1]
    tmp <- spectrum(y, plot=FALSE)
    p <- (1/tmp$freq*incr)[which.max(tmp$spec)] # max of spectrum
    p
}

x <- seq(0, 50, by = 0.05)
y <- sin(x)
p <- calcPeriod(x, y) # result = 2pi
[edit]
13 beta #
л°Ҙк·ёлҰҮ лӘЁм–‘
tmp <- textConnection(
  "prop	seq
0.12	1
0.13	2
0.09	3
0.05	4
0.04	5
0.04	6
0.03	7
0.02	8
0.02	9
0.03	10
0.01	11
0.01	12
0.02	13
0.05	14
0.03	15
0.02	16
0.02	17
0.02	18
0.02	19
0.03	20
0.08	21")
mydata <- read.table(tmp, header=TRUE)
close.connection(tmp)
head(mydata)

mydata$x <- mydata$seq / (nrow(mydata)+1)

barplot(mydata$prop, names.arg=mydata$grp)

#x<-seq(0.01, 0.99, 0.01)
#barplot(dbeta(x, 0.1, 0.4))

#install.packages("minpack.lm")
library("minpack.lm")
fit <- nlsLM(prop ~ dbeta(x, a, b) * c, start = list(a=0.1, b=0.4, c=0.1), data=mydata, trace=T)
summary(fit)

plot(mydata$x, mydata$prop, type="h", lwd = 10, col="lightGrey", ylim=c(0, 0.2))
lines(mydata$x,fitted(fit))
https://www.r-bloggers.com/fitting-distribution-x-to-data-from-distribution-y/
set.seed(3)
x <- rgamma(1e5, 2, .2)
plot(density(x))

# normalize the gamma so it's between 0 & 1
# .0001 added because having exactly 1 causes fail
xt <- x / ( max( x ) + .0001 )

# fit a beta distribution to xt
library( MASS )
fit.beta <- fitdistr( xt, "beta", start = list( shape1=2, shape2=5 ) )

x.beta <- rbeta(1e5,fit.beta$estimate[[1]],fit.beta$estimate[[2]])

## plot the pdfs on top of each other
plot(density(xt))
lines(density(x.beta), col="red" )

## plot the qqplots
qqplot(xt, x.beta)
[edit]
14 95% мӢ лў°кө¬к°„ #
мҳҲм ң
plot(df$x,df$y,xlim=c(0,0.7),pch=20) xnew <- seq(par()$usr[1],par()$usr[2],0.01) RegLine <- predict(m0,newdata = data.frame(x=xnew)) lines(xnew,RegLine,lwd=2) lines(xnew,RegLine+summary(m0)$sigma*1.96,lwd=2,lty=3) lines(xnew,RegLine-summary(m0)$sigma*196,lwd=2,lty=3)--м¶ңмІҳ: https://stackoverflow.com/questions/32459480/r-confidence-bands-for-exponential-model-nls-in-basic-graphics
[edit]
16 Laplace Distribution(Double exponential) #
--https://stats.stackexchange.com/questions/261673/double-exponential-fit-in-r
test <- data.frame(times=c(0,5,10,15,30,50,60,90,120,180,240), RNA=c(0.48, 1.15, 1.03, 1.37, 5.55, 16.77, 20.97, 21.67, 10.50, 2.28, 1.58))

nonlin <- function(t, a, b, c) { a * (exp(-(abs(t-c) / b))) }
nlsfit <- nls(RNA ~ nonlin(times, a, b, c), data=test, start=list(a=25, b=20, c=75))

with(test, plot(times, RNA, pch=19, ylim=c(0,40)))
tseq <- seq(0,250,.1)
pars <- coef(nlsfit)
print(pars)
lines(tseq, nonlin(tseq, pars[1], pars[2], pars[3]), col=2)
п»ҝ


![[http]](/moniwiki/imgs/http.png)