Contents

[-]
1 비선형
2 n차 함수 curve fitting
3 self-starting function
4 inverse.predict
5 bi-exponential
6 exp * 3
7 log-normal function
8 pareto
9 멱함수 3개
10 주기 알아내기
11 smooth
12 비선형 회귀 신뢰구간
13 beta
14 95% 신뢰구간
15 sigmoid 0 ~ 1
16 Laplace Distribution(Double exponential)
17 참고자료


library(nlstools)
plotfit(fit, smooth=TRUE)
overview(fit)

fit.boot <- nlsBoot(fit, niter = 200)
summary(fit.boot)

1 비선형 #

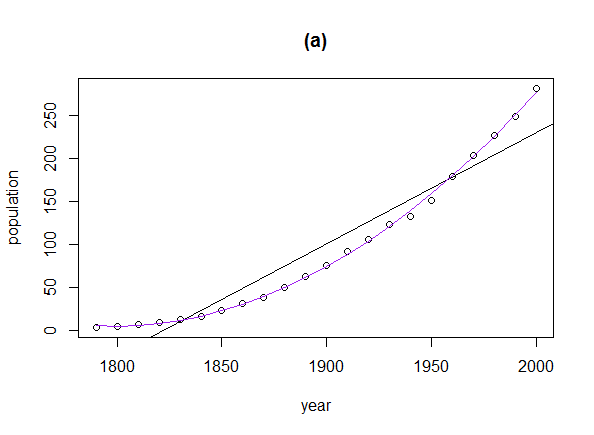
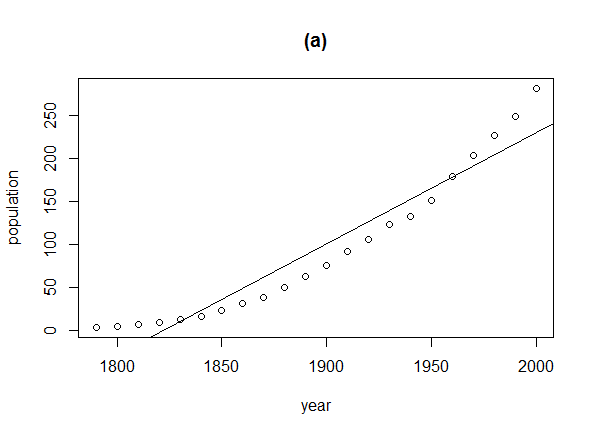
다음의 자료를 보면, 선형이 아님을 알 수 있다.
install.packages("car")
library("car")
plot(population ~ year, data=USPop, main="(a)")
abline(lm(population ~ year, data=USPop))
nls01.png

2 n차 함수 curve fitting #

curve fitting 해보자.
xx <- USPop$year
fit <- lm(population ~ poly(year, 2), data=USPop)
lines(xx, predict(fit, data.frame(year=xx)), col="purple")
nls02.png

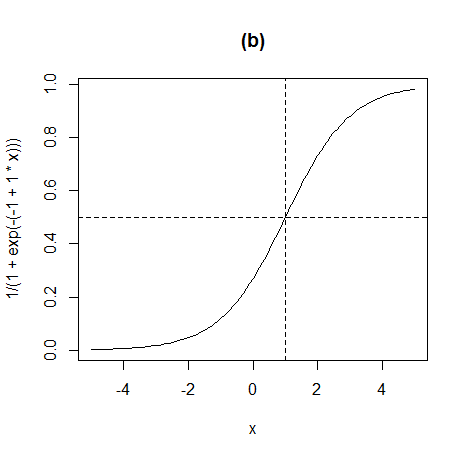
그런데 USPop 데이터는 아래와 같은 logistic growth model 이라고 한다.
curve(1/(1+exp(-(-1 + 1*x))), from=-5, to=5, main="(b)")
abline(h=1/2, lty=2)
abline(v=1, lty=2)
nls03.png

3 self-starting function #

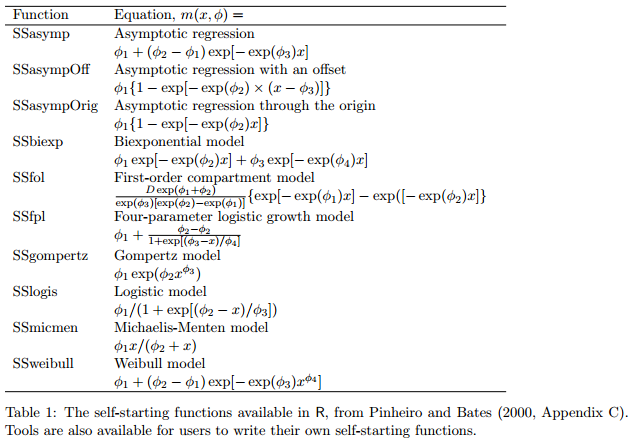
n차함수로 fitting 하는 것은 위와 같이 하면 되고, 아마도 대부분은 알려진 공식들일 것이다. 아래는 self-starting function들이다.

nls04.png

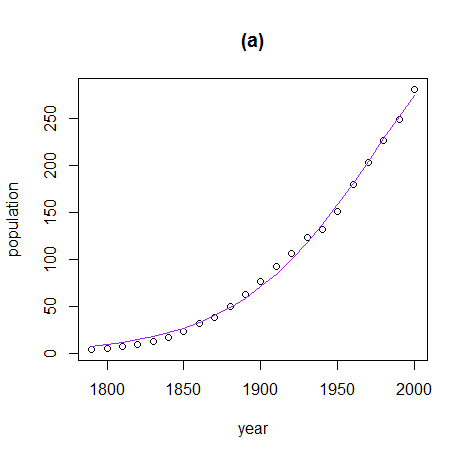
n차함수 curve fitting이나 아래와 같이 self-starting function을 이용하면 될 것이다.
fit <- nls(population ~ SSlogis(year, Asym, xmid, scal), data=USPop)
summary(fit)
xx <- USPop$year
plot(population ~ year, data=USPop, main="(a)")
lines(xx, predict(fit, data.frame(year=xx)), col="purple")
nls05.png

SSasymp(input, Asym, R0, lrc)
SSasympOff(input, Asym, lrc, c0)
SSasympOrig(input, Asym, lrc)
SSbiexp(input, A1, lrc1, A2, lrc2)
SSfol(Dose, input, lKe, lKa, lCl)
SSfpl(input, A, B, xmid, scal)
SSgompertz(input, Asym, b2, b3)
SSlogis(input, Asym, xmid, scal)
SSmicmen(input, Vm, K)
SSweibull(input, Asym, Drop, lrc, pwr)

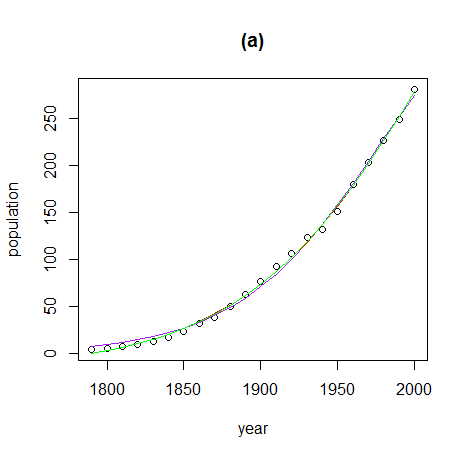
아래는 self-starting function 몇 개를 적용한 것을 차트로 비교해본 것이다. self-starting function의 파라미터는 적당한(예를 들어, help와 같이) 변수를 넣고, 에러가 나면 안되는거고, 되는 되는 거고다.
xx <- USPop$year
plot(population ~ year, data=USPop, main="(a)")

fit1 <- nls(population ~ SSlogis(year, Asym, xmid, scal), data=USPop)
lines(xx, predict(fit1, data.frame(year=xx)), col="purple")

fit2 <- nls(population ~ SSweibull(year, Asym, Drop, lrc, pwr), data=USPop)
lines(xx, predict(fit2, data.frame(year=xx)), col="red")

fit3 <- nls(population ~ SSfpl(year, A, B, xmid, scal), data=USPop)
lines(xx, predict(fit3, data.frame(year=xx)), col="green")
nls06.png

추가 self-starting function
https://cran.r-project.org/web/packages/nlraa/vignettes/nlraa.html
Functions in ‘base’ R
stats package

SSasymp (Asymptotic)
SSasympOff (Asymptotic with an offset)
SSasympOrig (Asymptotic through the Origin)
SSbiexp (Bi-exponential)
SSfol (First order compartment)
SSfpl (Four parameter logistic)
SSgompertz (Gompertz)
SSlogis (Logistic)
SSmicmen (Michaelis-Menten)
SSweibull (Weibull)

Functions in this package (nlraa)

SSbgf (Beta-Growth Function)
SSbgf4 (Four Parameter Beta-Growth Function)
SSbgrp (Beta-Growth Reparameterized)
SSbg4rp (Four Parameter Beta-Growth Reparameterized)
SSdlf (Declining Logistic Function)
SSricker (Ricker population growth)
SSprofd (Profile of protein distribution)
SSnrh (Non-rectangular hyperbola)
SSlinp (linear-plateau)
SSplin (plateau-linear)
SSquadp (quadratic-plateau)
SSpquad (plateau-quadratic)
SSblin (bilinear)
SSexpf (exponential function)
SSexpfp (exponential-plateau)
SSpexpf (plateau-exponential)
SSbell (bell-shaped function)
SSratio (rational function)
SSlogis5 (five-parameter logistic)
SStrlin (tri-linear function)
SSexplin (expolinear)

4 inverse.predict #

install.packages("chemCal")
library("chemCal")

fit1 <- rlm(dau ~ x, data=tmp)
inverse.predict(fit1, 500000) #dau가 500000이 되려면 x는 몇이어야 하는가?

5 bi-exponential #

> head(df)
  seq    u
1   1 4311
2   2 2381
3   3 1981
4   4 1529
5   5 1386
6   6 1340

x1 <- df[1:7,]
x2 <- df[8:nrow(df),]

cc1 <- coef(lm(log(u) ~ seq, data=x1))
cc2 <- coef(lm(log(u) ~ seq, data=x2))

fit <- nlsLM(u ~ a*exp(b * seq) + c * exp(d * seq),
             start = list(a=cc1[1], b=cc1[2], c=cc2[1], d=cc2[2]), 
             data=df)

6 exp * 3 #

#exp * 3
r <- sort(unique(df.ko$ranking))
xlim <- c(1,max(r))
ylim <- c(0, max(df.ko$amt) + max(df.ko$amt) * 0.3) 
plot(df.ko$ranking, df.ko$amt, cex=0.1, pch=19, xlim=xlim, ylim=ylim, xlab="차수", ylab="u", main="bi-exp")

x1 <- df.ko[df.ko$ranking <= 7,]
x2 <- df.ko[df.ko$ranking >  7 & df.ko$ranking <= 20 ,]
x3 <- df.ko[df.ko$ranking >  21,]

cc1 <- coef(lm(log(amt) ~ ranking, data=x1))
cc2 <- coef(lm(log(amt) ~ ranking, data=x2))
cc3 <- coef(lm(log(amt) ~ ranking, data=x3))

fit <- nlsLM(u ~ a*exp(b * seq) + c*exp(d * seq) + e*exp(f * seq),
             start = list(a=cc1[1], b=cc1[2], c=cc2[1], d=cc2[2], e=cc3[1], f=cc3[2]), 
             data=df)
summary(fit)
lines(r, predict(fit, data.frame(ranking=r)), col="red")
#text(df$seq, df$u, df$w, cex=0.5, pos=4)

amt1 <- predict(fit, data.frame(ranking=r))
amt1 / sum(amt1)

r <- sort(unique(df.ko$ranking))
xlim <- c(1,max(r))
ylim <- c(0, max(df.ko$amt) + max(df.ko$amt) * 0.3) 
plot(df.ko$ranking, df.ko$amt, cex=0.1, pch=19, xlim=xlim, ylim=ylim, xlab="랭킹", ylab="매출", main="한국")
lines(r, predict(fit, data.frame(ranking=r)), col="red")

lines(r, coef(fit)[1]*exp(coef(fit)[2] * df$seq), col="blue")
lines(r, coef(fit)[3]*exp(coef(fit)[4] * df$seq), col="green")
lines(r, coef(fit)[5]*exp(coef(fit)[6] * df$seq), col="black")


7 log-normal function #

fun <- function(x, mu, sd){
    a <- 1/(x * sqrt(2*pi*sd))
    b <- (log(x)-mu)^2 * -1
    c <- 2 * sd^2
    return (a * exp(b/c))
}

예제
#data
val <- c(462604.2114,724545.9975,677961.1773,556621.1925,572068.4823,550408.0245,442748.9577,463050.285,485241.4509,406399.9335,394768.1661,474606.3792,408121.4988,254290.8273,234755.1933,201690.9834,
175243.2,171106.0665,228024.2613,199481.5251,141505.8969,148199.988,138756.7692,140078.0631,146512.2765,183688.7274,169084.7955,103705.1421,107350.3998,106554.8355,99301.161,105367.9611,148672.9455,
135343.5096,73087.3671,75604.4967,69973.8132,66367.3878,72191.2371,98143.1619,88506.7773,59722.086,59705.1591,54111.3165,49504.2126,50762.7774,68940.2766,67763.3592,50401.3383,50509.8696,51749.5161,
56774.814,56875.3797,65898.4131,58036.3659,45687.6945,44862.2592,41548.5696,37896.342,39405.8232,54220.8435,50035.9164,36221.5746,35067.5583,33099.0594,41550.561,33312.1392,42200.7531,36982.2894,26394.0156,
25939.9764,24163.6476,23641.9008,25495.8942,35859.1398,31292.8596,20783.2461,21233.3025,20770.302,20744.4138,19822.3956,31262.9886,28102.6368,17650.7739,17666.7051,17097.1647,16079.5593,17644.7997,26329.2951,
22879.1946,14800.0848,15000.2205,15227.2401,19307.6187,20345.1381,27219.4509,22791.573,14828.9601,26459.7318,65060.0337)
seq <- 1:length(val)
tmp <- data.frame(seq, val)

#log-normal function
fun <- function(x, mu, sd){
    a <- 1/(x * sqrt(2*pi*sd))
    b <- (log(x)-mu)^2 * -1
    c <- 2 * sd^2
    return (a * exp(b/c))
}

#fitting
library("minpack.lm")
fit <- nlsLM(val ~ a * fun(seq, b, c) + d,
             start = list(a=1, b=0.01, c=100, d=1), 
             control = nls.lm.control(maxiter = 1000),
             trace = TRUE,
             data=tmp)

#plotting
r <- sort(unique(tmp$seq))
xlim <- c(1,max(r))
ylim <- c(0, max(tmp$val) + max(tmp$val) * 0.3) 
plot(tmp$seq, tmp$val, cex=0.1, pch=19, xlim=xlim, ylim=ylim)
lines(r, predict(fit, data.frame(seq=r)), col="red")
8 pareto #

pareto <- function(y, m, s) {
  return (s * (1 + y/(m * (s-1)))^(-s-1)/(m * (s-1)))
}

또는

install.packages("rmutil")
library("rmutil")

dpareto(y, m, s, log=FALSE)
ppareto(q, m, s)
qpareto(p, m, s)
hpareto(y, m, s)
rpareto(n, m, s)

9 멱함수 3개 #

library("minpack.lm")
fit <- nlsLM(u ~ a*seq^b + c*seq^d + e*seq^f, 
             start = list(a=40000000, b=-0.05, c=8015503, d=-0.05, e=1674444, f=-0.05), 
             control = nls.lm.control(maxiter=1000),
             data=df, trace=T)
summary(fit)

10 주기 알아내기 #

calcPeriod <- function(x, y){
    incr <- x[2] - x[1]
    tmp <- spectrum(y, plot=FALSE)
    p <- (1/tmp$freq*incr)[which.max(tmp$spec)] # max of spectrum
    p
}

x <- seq(0, 50, by = 0.05)
y <- sin(x)
p <- calcPeriod(x, y) # result = 2pi

11 smooth #

http://www.r-bloggers.com/principal-curves-example-elements-of-statistical-learning/

animation-1.gif

12 비선형 회귀 신뢰구간 #

https://rmazing.wordpress.com/2013/08/26/predictnls-part-2-taylor-approximation-confidence-intervals-for-nls-models/

13 beta #

밥그릇 모양
tmp <- textConnection( 
  "prop	seq
0.12	1
0.13	2
0.09	3
0.05	4
0.04	5
0.04	6
0.03	7
0.02	8
0.02	9
0.03	10
0.01	11
0.01	12
0.02	13
0.05	14
0.03	15
0.02	16
0.02	17
0.02	18
0.02	19
0.03	20
0.08	21") 
mydata <- read.table(tmp, header=TRUE)
close.connection(tmp)
head(mydata)

mydata$x <- mydata$seq / (nrow(mydata)+1)

barplot(mydata$prop, names.arg=mydata$grp)

#x<-seq(0.01, 0.99, 0.01)
#barplot(dbeta(x, 0.1, 0.4))

#install.packages("minpack.lm")
library("minpack.lm")
fit <- nlsLM(prop ~ dbeta(x, a, b) * c, start = list(a=0.1, b=0.4, c=0.1), data=mydata, trace=T)
summary(fit)

plot(mydata$x, mydata$prop, type="h", lwd = 10, col="lightGrey", ylim=c(0, 0.2))
lines(mydata$x,fitted(fit))


https://www.r-bloggers.com/fitting-distribution-x-to-data-from-distribution-y/
set.seed(3)
x <- rgamma(1e5, 2, .2)
plot(density(x))
 
# normalize the gamma so it's between 0 & 1
# .0001 added because having exactly 1 causes fail
xt <- x / ( max( x ) + .0001 )
 
# fit a beta distribution to xt
library( MASS )
fit.beta <- fitdistr( xt, "beta", start = list( shape1=2, shape2=5 ) )
 
x.beta <- rbeta(1e5,fit.beta$estimate[[1]],fit.beta$estimate[[2]])
 
## plot the pdfs on top of each other
plot(density(xt))
lines(density(x.beta), col="red" )
 
## plot the qqplots
qqplot(xt, x.beta)

14 95% 신뢰구간 #

예제
plot(df$x,df$y,xlim=c(0,0.7),pch=20)
xnew <- seq(par()$usr[1],par()$usr[2],0.01)
RegLine <- predict(m0,newdata = data.frame(x=xnew))
lines(xnew,RegLine,lwd=2)
lines(xnew,RegLine+summary(m0)$sigma*1.96,lwd=2,lty=3)
lines(xnew,RegLine-summary(m0)$sigma*196,lwd=2,lty=3)
--출처: https://stackoverflow.com/questions/32459480/r-confidence-bands-for-exponential-model-nls-in-basic-graphics

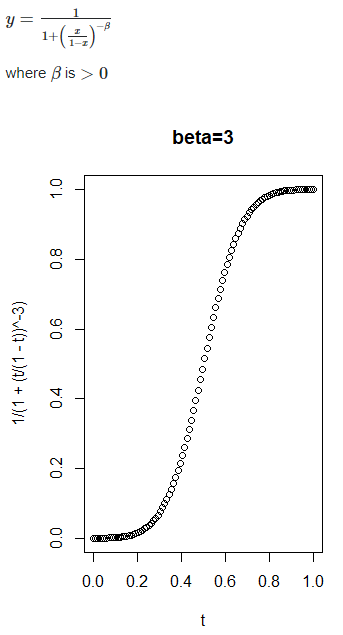
15 sigmoid 0 ~ 1 #

https://stats.stackexchange.com/questions/214877/is-there-a-formula-for-an-s-shaped-curve-with-domain-and-range-0-1
sigmoid_0_1.png

16 Laplace Distribution(Double exponential) #

--https://stats.stackexchange.com/questions/261673/double-exponential-fit-in-r
test <- data.frame(times=c(0,5,10,15,30,50,60,90,120,180,240), RNA=c(0.48, 1.15, 1.03, 1.37, 5.55, 16.77, 20.97, 21.67, 10.50, 2.28, 1.58))

nonlin <- function(t, a, b, c) { a * (exp(-(abs(t-c) / b))) }
nlsfit <- nls(RNA ~ nonlin(times, a, b, c), data=test, start=list(a=25, b=20, c=75))

with(test, plot(times, RNA, pch=19, ylim=c(0,40)))
tseq <- seq(0,250,.1)
pars <- coef(nlsfit)
print(pars)
lines(tseq, nonlin(tseq, pars[1], pars[2], pars[3]), col=2)


17 참고자료 #